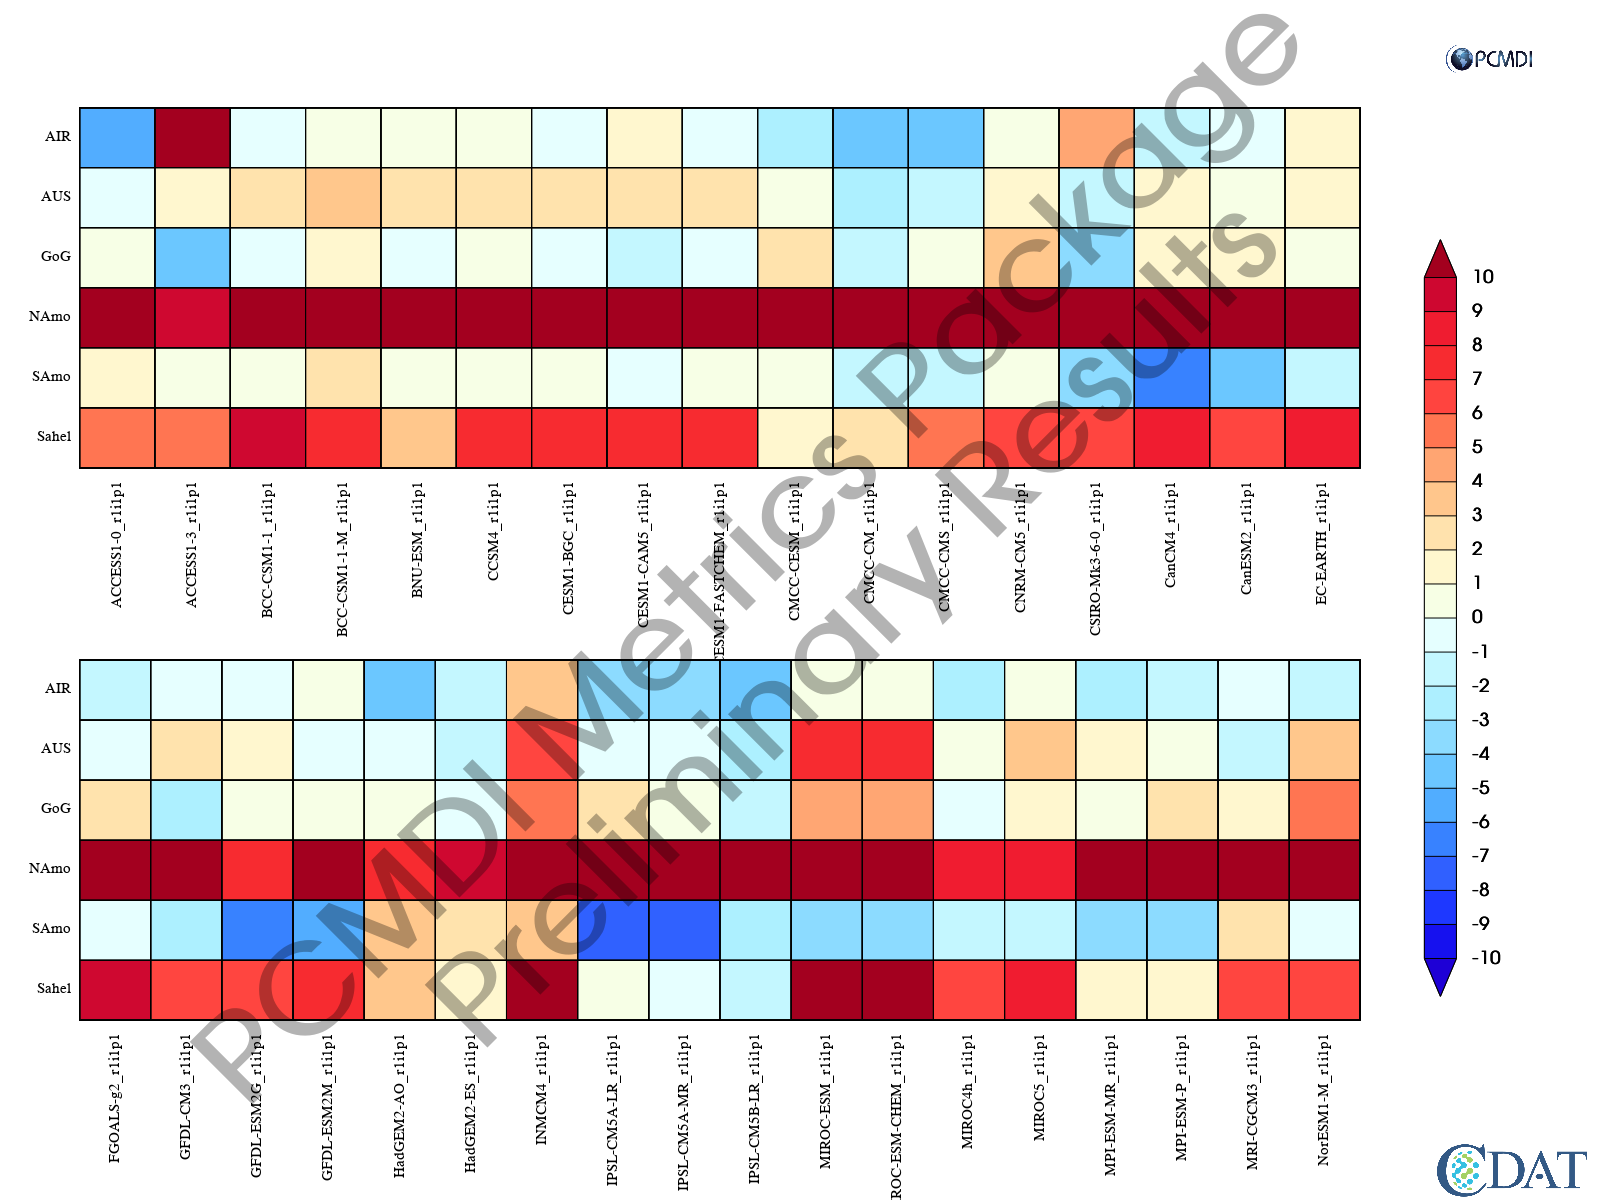
Monsoon_sperber: CMIP5 Historical, duration_rel2obs
Interactive viewing of the diagnostics from which the metrics were computed: Zoom in/out on your browser to adjust the size of the portrait plot. Hover your mouse over the colored square to see a thumbnail of the diagnostics from which the metric (colored square) was produced. Click for a larger version of the diagnostic plot.