Hover mouse over x-axis labels and click on a variable to see Taylor Diagrams. Hover mouse over a triangle and click to see maps from which the statistics were derived.
Prototype: With the current version, please do NOT click on GREY boxes (missing data), otherwise you will need to refresh the browser.
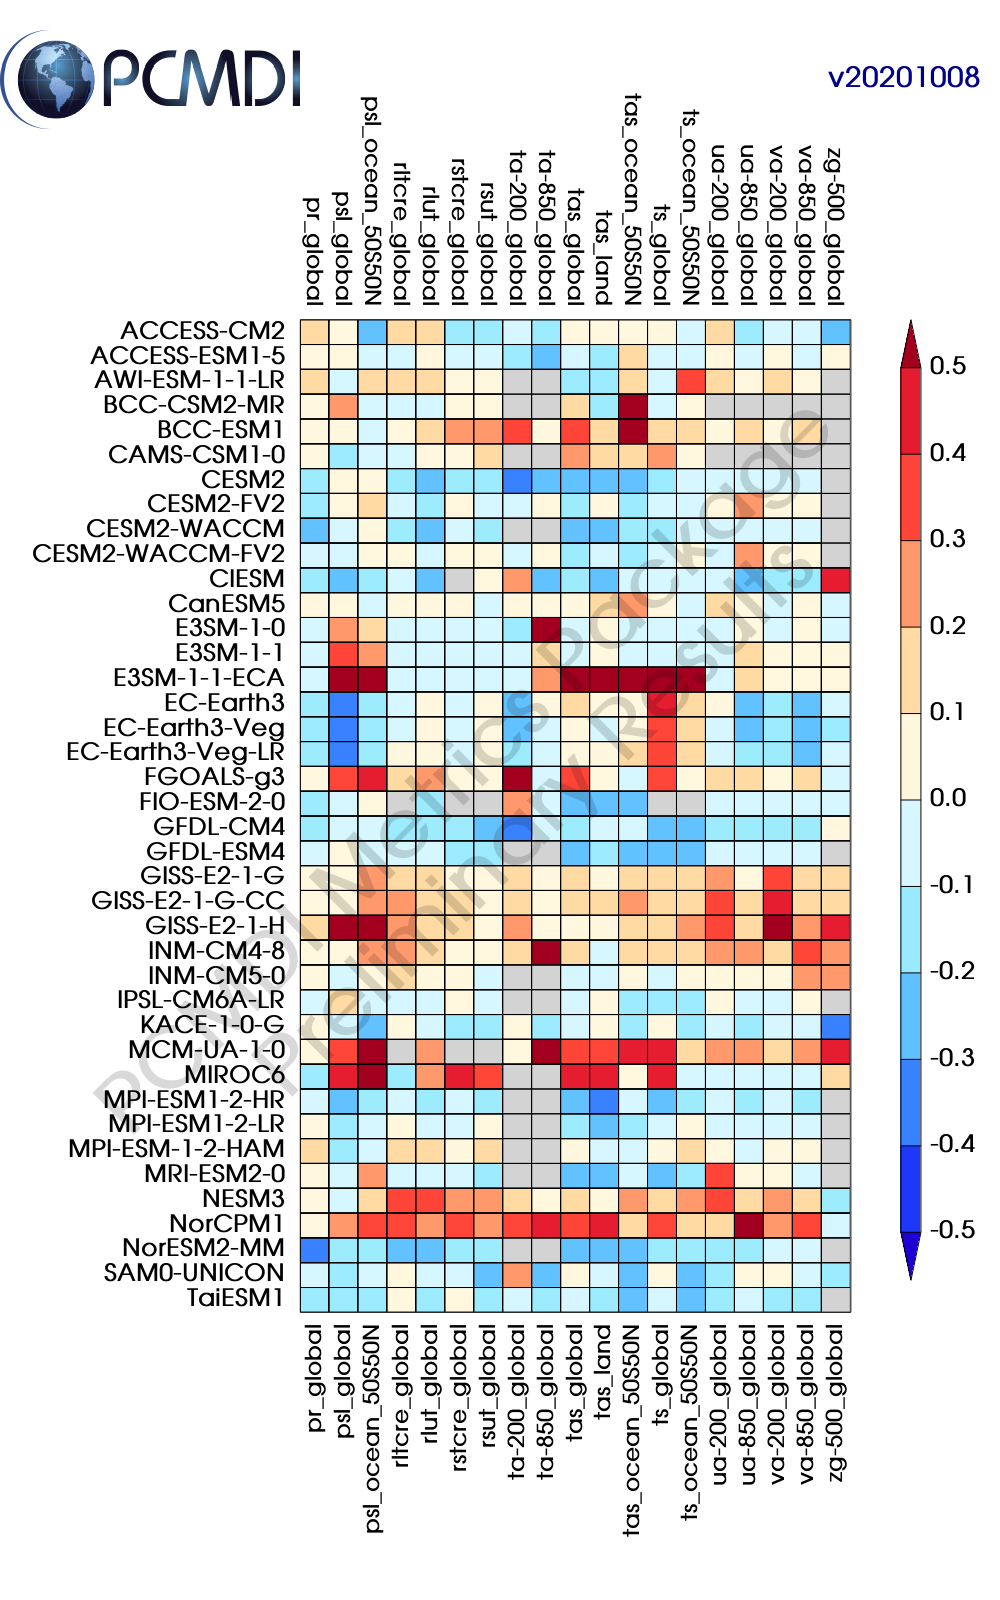
Quality control of the results below is ongoing.
- Statistics: rms_xyt
- Data version: v20201008
- Plot version: v20201008