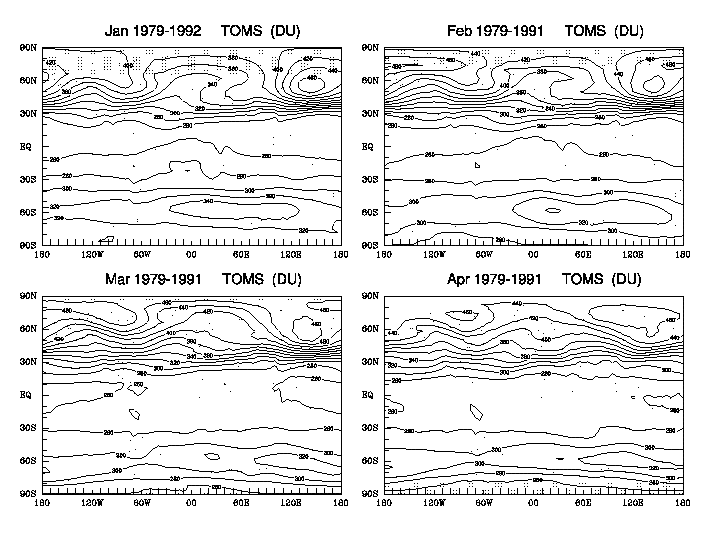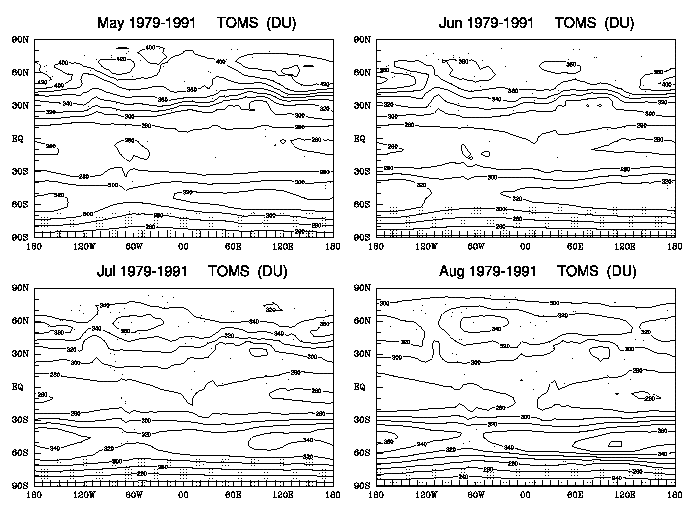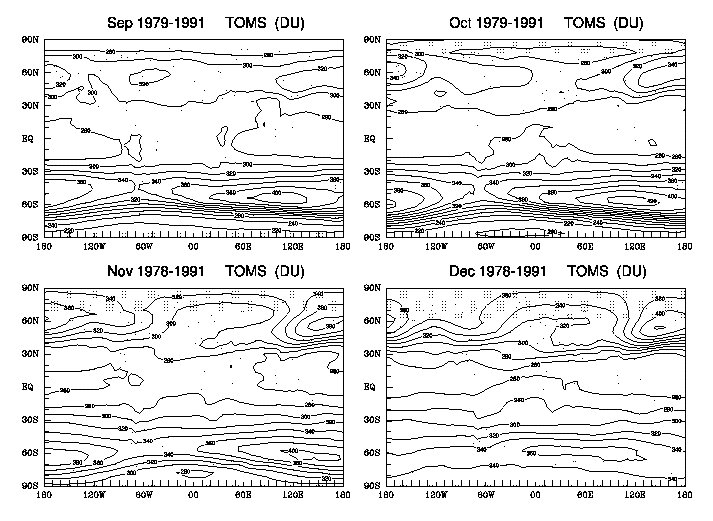
Fig. 5: Monthly mean climatological longitude-latitude distributions of total O3 amount (Dobson unit or 10-3 cm-STP) as derived from the TOMS analyzed data between November 1978 and January 1992. The contour interval is 20 units, and the shaded areas indicate where the raw measurements are missing.


