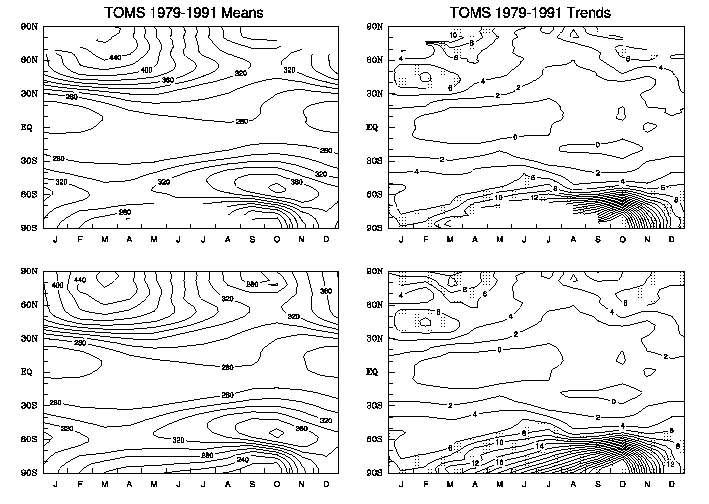
Fig. 3: Seasonal variations of climatological zonal Means
(Dobson unit or 10-3 cm-STP) and linear decreasing
relative Trends (%/decade) of total O3 amount as
derived from the TOMS raw measurements (top) and the analyzed data (bottom)
during 1979-1991. The contour interval is 20 units for the means, and 2 for the
trends. Trends of O3 relative decreases greater than 6
units are shaded.
