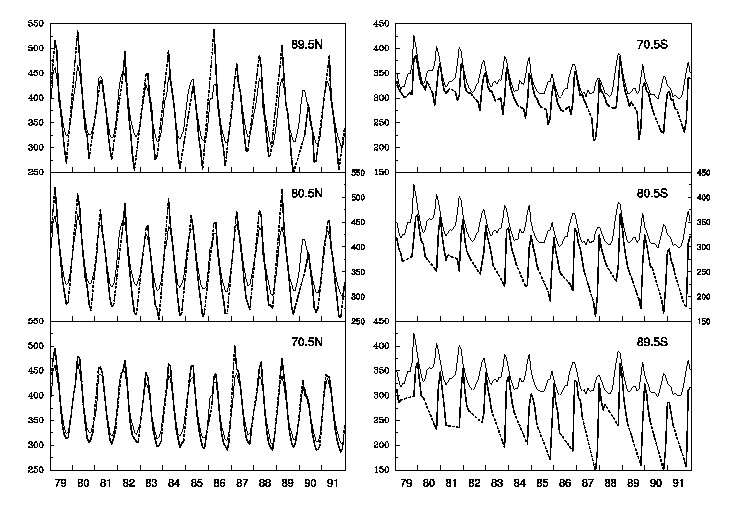
Fig. 2: Monthly series of zonal mean total O3 amount (Dobson unit or 10-3 cm-STP) at north (south) polar latitudes 89.5, 80.5 and 70.5_N (_S) during 1979-1991. Solid curves are plotted from the TOMS raw measurements while dashed segmentations are from the analyzed data. For reference, the measured series at 60.5_N (_S) are shown in each northern (southern) latitude plot.
